
Start a management degree at American Public University. |
By Dr. John Richard Horne
Faculty Member, School of Business, American Public University
We hear lots of talk these days about data without any real understanding of precisely what the word means. Data is a “stand in” that represents a reality.
If we say “sales data for last month,” for example, the data point — whether it’s $5,000 or $5 million — makes no difference. The data point is simply a picture at a point in time from one specific perspective.
From this description, that data point tells us very little about its overall significance and context. Is $5 million a good or a bad number? What does that $5 million mean for the future of a company?
When you’re thinking about business data, it is important to think multi-dimensionally. It is not enough just to note the sales numbers for a given time period. You have to ask, “What does that data point mean to our company?” Actually, it tells us very little in the strategic sense.
Looking at Business Data through a Multi-Dimensional Framework
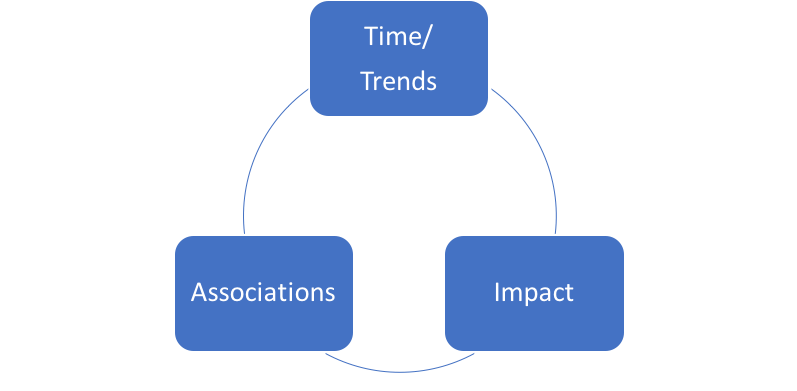
Business data can be analyzed in three areas: time and trends, impact and associations. The following graphic provides a framework for multi-dimensional data analysis:
Time and Trends Analysis
Determining the trends and changes over time of sales data is perhaps more significant to the company than focusing on sales for any one period. Within any set of sales data points, there may be seasonal and cyclical trends that are much more meaningful than the one data point.
Also, embedded within a series of business data points could be sales growth (or declining) figures that might be masked by seasonal or cyclical sales trends. The key point is not to place too much importance on any one month’s data, but try to understand the full sales timeline.
Some advanced calculation tools, like a statistical process control chart, could be used to see if the sales are within a standard of normal variation over a period of time. However, it’s important to realize that seasonal and cyclical trends might give a false reading of your business success.
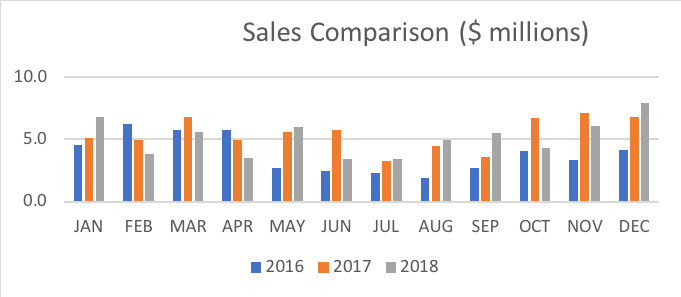
Another way to approach this analysis is to place your monthly sales figures beside 12-month, 24-month or 36-month comparisons. This approach would tell you how this April’s sales compared to last April’s sales or the sales of two years ago.
Impact Analysis
In managing a large for-profit company, the profit, or bottom line, is the key single metric that stakeholders care about when they evaluate the overall health and viability of their company. However, most companies of any size have several key management initiatives or objectives that also concern them.
For instance, some companies want to drive their own internal innovation efforts by setting specific goals, such as “15% of our sales are to be from products/services that were initiated within the last five years.” This goal requires ways to track its success or failure.
For example, using the bar graph above, what percentage of the $5 million in sales last month came from products/services less than five years old? Instead of tracking the $5 million on a chart, we could track the percentage of sales from new products/services. This chart would link directly to one of management’s key objectives.
In another example, let’s say that another key management objective is to expand the company market from a regional business to a nationwide company. The $5 million figure would tell us how well the company is achieving this objective.
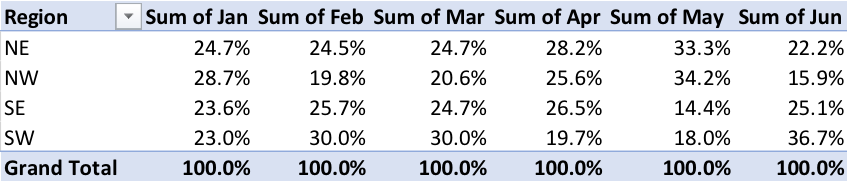
However, what would be of more interest is the percentage of sales that comes from other states. A basic bar chart could show the categories of different states or regions on the Y axis along a monthly X axis of sales figures.
The following is an example of how metrics can monitor strategic objectives such as changes in regional sales. This chart compares sales between regions to see how they stack up.
Data Analysis through Associations
Another way to look at business data is to consider whether the metric is a leading or a lagging indicator.
A lagging indicator consists of historic sales data. It’s useful, but you can’t manage a business just by looking in the rearview mirror.
A leading indicator consists of metrics that look to the future. For example, let’s say you own a convenience store near a highway and know your sales figures relative to the traffic flow on the highway.
Later, you learn there are plans to widen the highway next year. You could estimate your sales increase based on the estimated increase in traffic within one year of the road’s widening. Tracking the expected traffic can be thought of as a leading indicator for your sales.
To get a holistic picture, your business should use a combination of leading and lagging indicators.
Real estate offers another example. Many real estate decisions are based on the prime lending rate set by the Federal Reserve Bank.
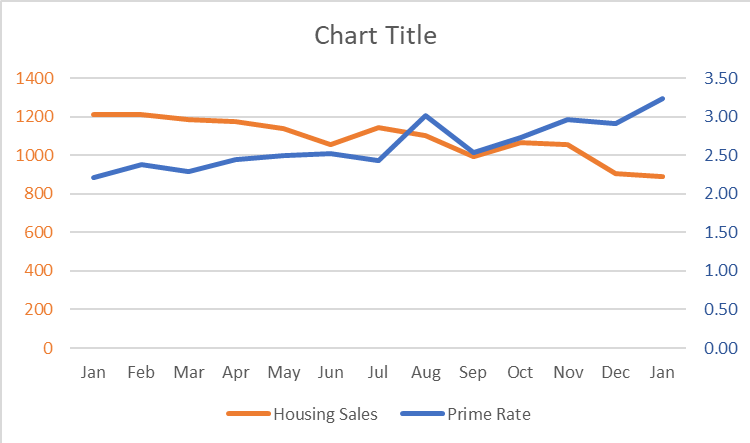
If there are indicators that the prime rate is going up or down, the changes in projected real estate sales could be more accurately predicted. The chart below is an example of how the prime rate might be portrayed for housing sales. As the prime rate moves up and creates more expensive home loans, sales move down.
Tracking profits and costs are certainly vital, but be sure to also take a holistic look at the corporate health of your organization. Checking your organization’s corporate health involves tracking:
- Business and workforce growth
- Asset utilization and accountability
- Inventory turn
- Data integrity and systems reliability
- Innovation and R&D
- Customers and changes to their demographics and wants/needs
- Quality, delivery and timeliness of products and services
Whenever you’re studying performance metrics and business data, it is best to “start wide” and use divergent thinking in the form of a multi-dimensional approach. Later, you can focus more on the vital metrics that matter most for your organization. That’s called convergent thinking.
About the Author
John Richard Horne is a part-time instructor in American Public University’s School of Business. He holds a master’s degree in general administration from Central Michigan University and a doctoral degree in business administration from Nova Southeastern University. John worked for 35 years with the federal government, mostly in logistics and installation management work. He retired from the Army Reserve after 30 years, spending about half his time in military intelligence and the other half in logistics positions. John continues to teach, write research articles, and remains active in local ASQ and PMI chapters and volunteer work.
Comments are closed.